Crypto Technical Analysis Update (3 Charts)

The crypto market has been extra volatile lately. So to cut out the noise and focus on what’s important, here’s some straightforward crypto technical analysis. In this article, we’ll analyze the Crypto Total Market Cap Index (TOTAL) in TradingView. TOTAL shows the market size of the biggest 125 cryptos, including bitcoin – so it can give us a general proxy for the market’s performance. Here are three charts to watch to understand what could be next for the index. I’ve also included an explainer video to describe each indicator.
Chart 1: The crypto market is (so far) bouncing off the 21-day EMA
Each red or green bar in the below chart represents one day of price movement for the Total Crypto Market Index (TOTAL). The yellow line is the 21-day exponential moving average (EMA). This line updates to show the average price TOTAL ended each day over the latest 21 days. But unlike a “simple” moving average, it puts more weight on recent-day prices.
So far, TOTAL is bouncing off the 21-day EMA, which is typically what you see when an investment is in a strong uptrend. So long as TOTAL stays above its 21-day EMA, that uptrend remains strong. On the flip side, if you see the index end a day below the 21-day EMA (and the line starts to slope down) the crypto pullback could get worse.
For reference, the 21-day EMA is currently at about $2.4 trillion (the market size of the top 25 cryptos). But keep in mind the line is sloping up right now, so that level could creep up in the coming days.
Video explanation of exponential moving averages (EMAs)
Watch this quick video below (taken from our technical analysis course) to learn more about exponential moving averages (EMAs). For this video, I’m using weekly moving averages rather than daily (to take a more zoomed-out view).
Chart 2: Crypto market RSI hidden bullish divergence
The Relative strength index (RSI) has been trending down this month for TOTAL. Again, each red or green bar in the chart below shows one day of price movement. Notice how the price of TOTAL is potentially making a higher low, while the RSI is making a lower low – aka hidden bullish divergence.
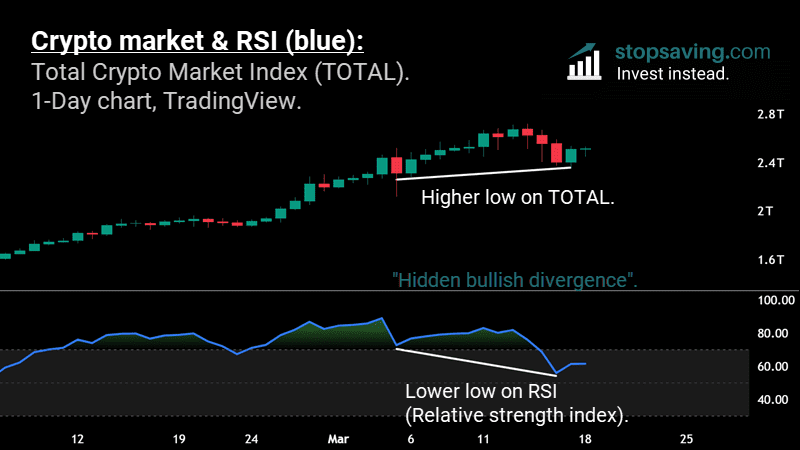
The RSI measures the relative strength of buying pressure vs the relative strength of selling pressure. It does this by dividing the average percent gain of “up days” by the average percent loss of “down” days (over the past 14 days). So in the chart above, selling pressure is getting stronger since the RSI is going down. But despite that stronger selling pressure, the price of TOTAL is still (potentially) making a higher low.
Video explanation of RSI hidden bullish divergence
Watch this video below for a deeper explanation of RSI hidden bullish divergence.
Chart 3: Crypto market key Fibonacci levels to watch
The next chart shows the key Fibonacci retracement levels to watch for TOTAL. Right now, the crypto market size is about $2.47 trillion. So far, the bounce from $2.35 trillion has been “rejected” at the 0.5 Fibonacci retracement level (around $2.53 trillion). In other words, the price recovered 50% of its losses, then got pushed lower.
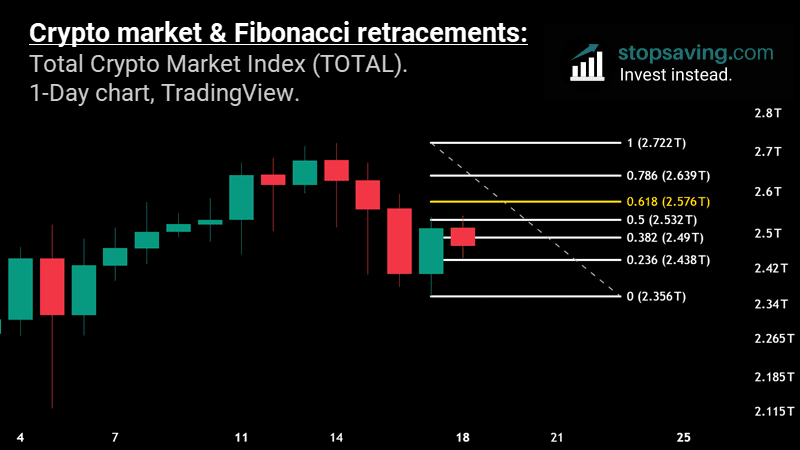
But all is not lost yet. It’s quite normal for the 0.5 Fibonacci retracement to push the price down on the first go. But if it tries to break it again, I’d want to see TOTAL at least get back above the 0.618 “golden” Fibonacci ($2.57 trillion). Then, if it starts to hold above that level, we might see an extension of the rally above the $2.72 trillion peak (and possibly more from there). But as long as it’s below the 0.618 Fibonacci level, there could be more risk of lower prices.
If you’ve enjoyed this post so far, sign up for our newsletter below. You’ll get how-to guides and investment ideas across crypto, stocks, metals, and more.
Video explanation of Fibonacci retracements
Here’s a short video to explain why traders pay close attention to Fibonacci retracements.
Crypto technical analysis summary
So long as TOTAL keeps closing daily candles above the 21-day EMA, it’s hard to get too bearish on crypto – yet. But if the index loses the 21-day EMA, the RSI hidden bullish divergence would also fail. At that point, I’d expect TOTAL to re-test the $2.35 trillion low from Sunday. And if it doesn’t bounce there, crypto could have a much bigger correction ahead. And possibly a major dip buying opportunity.
As usual, none of this is investment advice. It’s just my opinion of a few price charts. But if you liked this crypto technical analysis update, try our technical analysis course with a 14-day free trial: