

A DIY Guide To Investing Like The Harvard And Yale Endowment Funds

Back in 2014, I read a book called The Ivy Portfolio, by Meb Faber, on how to invest like the top university endowment funds and avoid bear markets. In this article, we go over some key points of the book and see how we can potentially apply its strategy to our own investment portfolios.
Disclaimer: I do not take any credit for the Ivy Portfolio strategy. This was the work of the author and his team of researchers. I am just explaining what I took from the strategy.
What are endowment funds?
Charities, universities, hospitals and other similar entities have expenses that often run higher than the revenues they generate. These entities use endowment funds as a means to pay for some or all of their expenses today and in the future.
Endowment funds are often funded by donations. Endowments try to stretch donations as far as possible by investing them into different assets to earn high investment returns.
Through investment returns, most endowment funds aim to achieve two core objectives:
- Payout X amount of money each year to beneficiaries (i.e. hospitals, churches, charities).
- Maintain the fund’s real value (value after inflation) for as long as possible so that they can keep paying beneficiaries for many years.
Endowments are often set up to last ‘forever’. This means they have extremely long-term investment time frames.
This allows them to invest in riskier assets (see box below) that may generate higher long-term investment returns. Because they have such long investment time horizons, endowments have many years to recover if an investment does badly in the short-term.
At the same time, endowments must control overall portfolio risk through diversification so they can continue paying beneficiaries far into the future.
What do endowment funds invest in?
Endowments often invest a portion of their assets in private equity and aggressive strategy hedge funds. I’ll cover these in detail in a future post, but for now, the key points are that these investments:
- Usually have lock-up periods, where investors can’t take their money out for a number of years after they’ve invested.
- Have the potential to generate very high returns over time.
- Are typically riskier than other investments like stocks, shares or bonds.
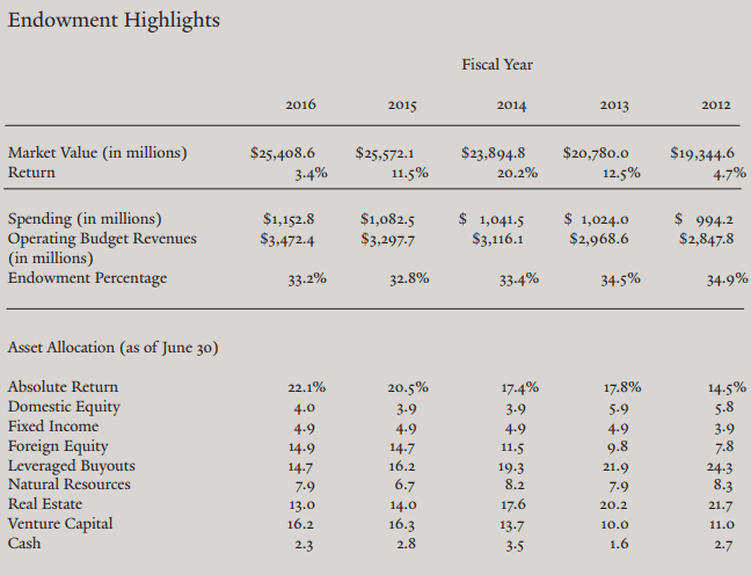
The bottom part of the table below shows Yale’s asset allocation (how the endowment fund is split amongst different investments) from 2012 to 2016 as they reported it in their 2016 endowment paper. Absolute return, venture capital and leveraged buyouts all fall into the riskier buckets.
Why are the Harvard and Yale Endowment Funds so special?
The Harvard and Yale endowment funds have both generated excellent investment returns over the years compared to other university endowments. I borrowed the below table from Vanguard to show this:
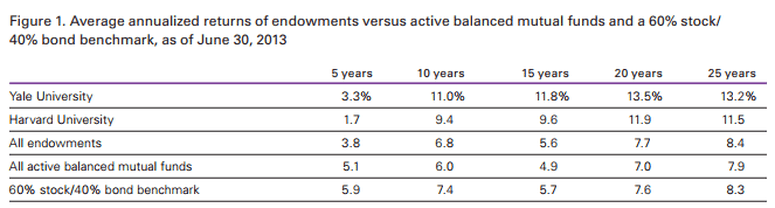
Unfortunately, the above results only go up to 2013. But here are some points to put the numbers into perspective:
- If you had invested £1,000 into the Yale Endowment in 1988, you would have around £22,190 by 2013. You would have made your money back more than 20 times over 25 years.
- If you had done the same with the Harvard Endowment, you would have around £15,200 by 2013.
- Putting £1,000 in the average endowment over the same time would only leave you with around £7,500.
You can download a spreadsheet here to try your own calculations like the above.
Besides having exceptional returns, both endowments have had much lower volatility in the past than the overall stock market. As mentioned in the book, the Yale endowment only had one losing year in 1988, when it lost 0.2%. Hardly a loss!
Can we invest in the same way as Harvard and Yale?
For most of us, sadly not. Here are some reasons why:
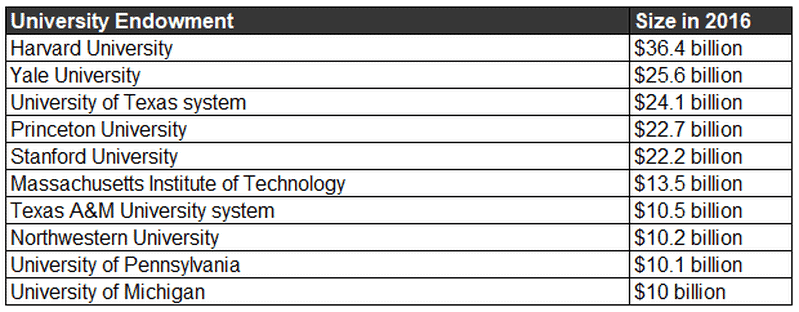
- Most people don’t have enough money to access the private investments of the endowments, many of which require millions to get involved. The table below taken from CNN money shows the total sizes of the top 10 American University endowment funds in 2016:
- While we can easily access the talents of great fund managers to choose our stocks and bonds, we don’t have teams of Ivy league academics scouring the investment universe for real estate, private equity and other more bespoke investment opportunities.
- Unlike university endowments, we weren’t built to last more than 100 years. We don’t have as much time as endowments do to recover from short-term losses!
- Some endowment investments are very illiquid – they may lock investors in for up to 20 years. Most people don’t want to wait 20 years to see an investment return.
Can we earn similar returns to the Harvard and Yale endowments for similar levels of risk?
Based on the research of the author, yes we can. And we don’t need to invest in illiquid private equity type investments to do it.
I’ve written a brief summary of the strategy from the book in the box below. This is just an overview, and by no means does it justice! So I encourage you to read the book for the full details.
The Ivy Portfolio: a brief overview of the strategy
1. Strategy aim:
To achieve similar returns to those of the Harvard and Yale endowment funds in a way that is accessible to the little guy. Just like the endowments, these returns should be achieved with relatively low levels of overall investment risk.
2. The Simple Ivy Portfolio
The simplest version of the strategy invests in 5 different asset classes:
- Domestic stocks (US stocks in the case of the author)
- Foreign stocks (non-US stocks)
- Bonds
- Real Estate
- Commodities
To simplify the strategy, each of the above assets takes up 20% of the total Ivy Portfolio.
The book proposes using Exchange Traded Funds (ETF’s) or index tracker funds to gain exposure to each asset class.
This is the Ivy Portfolio in its simplest form (see points below for how it is modified).
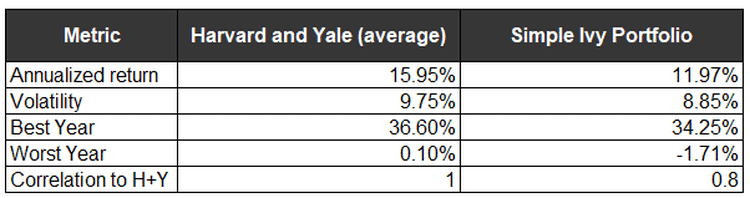
I’ve used some figures from the book to show how the simple Ivy Portfolio performed against an average of Harvard and Yale (or “HAY”) from the June 30th 1985 to June 30th 2008:
Simple Ivy Portfolio – 30 June 1985 – 30 June 2008
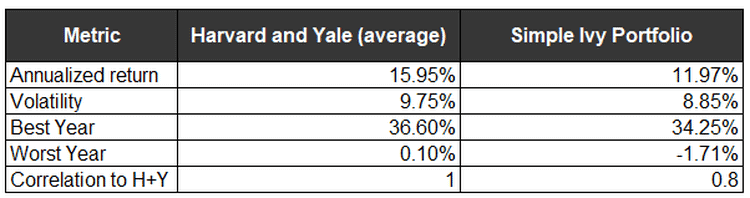
*The book takes the Harvard and Yale return figures from the Harvard and Yale endowment annual reports and runs from June 30th 1985 to June 30th 2008. It back tests the Simple Ivy Portfolio using past data. This data does not include the global stock market crash after June 2008. If we include the full year of 2008 (December 2007 – December 2008), the Simple Ivy Portfolio would have lost 29.76%. Harvard and Yale only report from June to June, so it is not known what they would have made from December 2007 to December 2008.
Over the time period shown, the simple Ivy Portfolio matched the Harvard and Yale portfolio (HAY) in volatility. But its annualised return is quite a bit lower.
The Simple Ivy Portfolio had a correlation of 0.8 with HAY. This means that its returns move up and down with HAYs returns 80% of the time.
3. The Timing Ivy Portfolio
To boost the returns so that they are more in line with HAY, the author introduces a market timing model.
The market timing model uses “buy” and “sell” rules depending on the monthly price of each of the 5 assets of the Simple Ivy Portfolio relative to 200-day Simple Moving Averages (or “200-day SMA“).
Simple Moving Average or “SMA” explained
The moving average is just what it sounds like…a “moving” average.
Over the last 200 days, the moving average price of an asset would equal the average price of the last 200 days.
Tomorrow, it would also equal the average price over the last 200 days.
The 200 day moving average of each day is plotted on a graph. Below is an example of the S&P 500 (to represent the US stock market) versus its 200-day simple moving average:
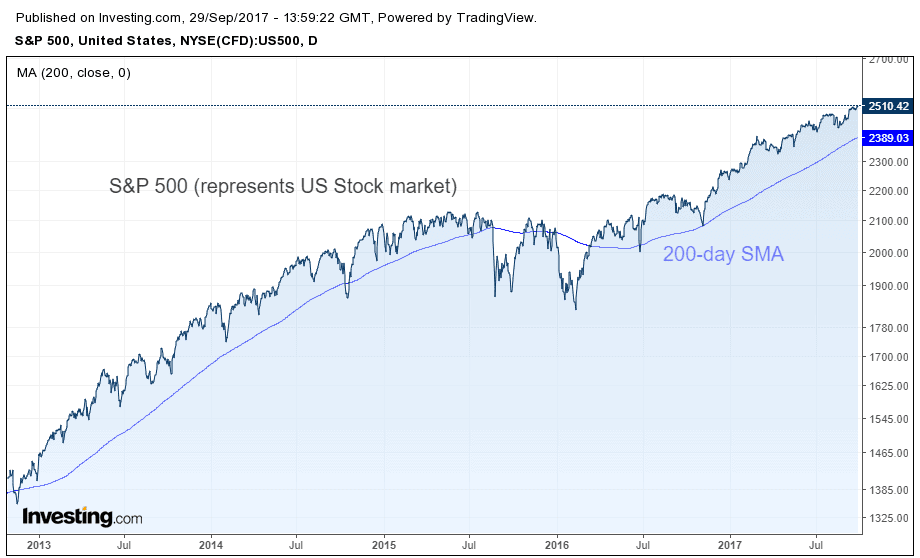
Notice above how the blue line is much smoother than the S&P 500.
Note: you can have moving averages for other time periods. Mathematically, the shorter the number of days of a moving average, the less smooth the curve.
Below are the buy and sell rules put forward by the author using the 200-day SMA for each of the 5 asset types in the Simple Ivy Portfolio:
Buy rule:
Buy if the asset price > 200-SMA on the last day of the month.
Sell rule:
Sell if the asset price < 200-SMA on the last day of the month. Hold cash until the next buying month (see buy rule above).
I created the table below using data from the book. It shows the timing model versus Harvard and Yale from June 30th 1985 to June 30th 2008.
Timing Ivy Portfolio (30 June 1985 – 20 June 2008)
Although the volatility is very low with the timing model, it still doesn’t achieve the same kind of returns as Harvard and Yale over the time period shown. The author then introduces another idea…
4. The Rotation Strategy Ivy Portfolio
The rotation system is an extension of the above Simple Ivy Portfolio with timing strategy. With the rotation strategy, the author proposes:
- At the end of each month, find the average returns for each asset class in the Simple Ivy Portfolio over the last 3, 6 and 12 months.
- Take an ‘average of the average‘ returns for 3, 6 and 12 months for each asset class.
- Rank the return performance of each of the 5 asset classes in the Simple Ivy Portfolio from best to worst based on the ‘average of the average’ returns from point 2 above.
- At the end of each month, only invest in the top 3 asset classes based on the above rankings. This means 1/3 of the portfolio is invested in each asset class at any point in time, unless…
- If any of the top 3 asset classes mentioned in point 4 above are trading below their 200-day SMAs, hold those portions of the portfolio as cash instead.
The table below (again all data is from the book) shows how the rotation strategy compared to Yale, Harvard and the Timing Ivy Portfolio strategy:
Rotation Ivy Portfolio with timing (30 June 1985 – 30 June 2008)
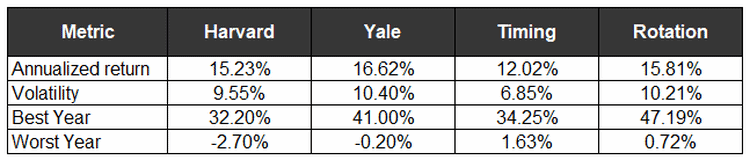
The table above shows that the Rotation strategy matches Harvard and Yale for returns and volatility over the time period shown.
5. Further extensions of the Ivy Portfolio
The author looks at many different variants of the strategy, such as:
- Using leverage (borrowing) to boost returns.
- Using more than 5 asset classes in the Ivy Portfolio.
- Using more or less than the top 3 asset classes in the rotation IVY Portfolio.
There are many others, and detailing them all here would turn this post into a book in and of itself.
The author does a great job in the book of back-testing all the different variants. Read the book if you would like to learn more.
6. Limitations of the strategy
With the rotation and timing strategies, there is more trading than with simple ‘Buy and Hold’. This could result in:
- Higher trading costs.
- More tax being paid when realising capital gains.
Using index tracker funds that don’t have trading costs to buy or sell fund units will prevent higher trading costs. Investing through an ISA or SIPP will resolve the tax issues.
The main limitation, however, lies in the testing of past data to predict how the model will work in the future. The only way the model can be truly tested is by using it for the next 100 or so years to see how it gets on.
Just because an investment strategy did well in the past doesn’t mean it will always work in the future.
That said, the book does a great job of extensively researching and testing past data, proving that the strategy would have worked well in the past.
7. How did the Ivy Portfolio do after 2008?
Meb Faber outlines the full details of the strategy in his white paper A Quantitative Approach To Tactical Asset Allocation.
The paper is 70 pages long and shows how a number of different variations of the Ivy Portfolio Strategy would have performed from 1973 all the way up to 2012. It’s an interesting read!
Using the Ivy Portfolio Strategy yourself:
If you’re thinking of using the Ivy Strategy yourself, then it goes without saying that you should first read the book to get a full understanding of it.
Another thing to be aware of is that the strategy is applied from the perspective of an American based investor. If like me you’re not from the USA then you will need to look at the type of ETF’s and/or index tracker funds available in your home country.
If I were to use this strategy, I would look at the index tracker funds available on the HL platform and experiment with different combinations. I prefer index tracker funds to ETF’s because there are usually no trading costs to buy or sell units.



